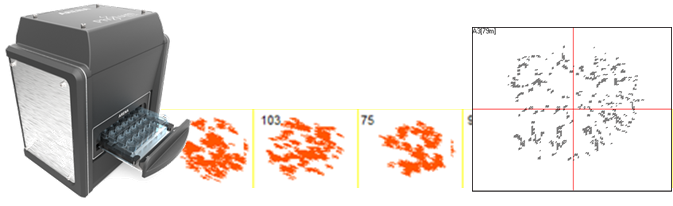
The Arena system detects the movement of the worm population by interrupting infrared microbeams, and the measurement unit is expressed as the cumulative number of microbeam interruptions, or “activity counts.” This value depends on the integration time block, or bin size, selected to report the data. Therefore, the output is reported in “activity counts / 15 minutes,” “activity counts / 30 minutes,” or “activity counts / 60 minutes.”
When data is exported in bin sizes of different durations, the mathematical algorithm extrapolates the activity counts observed on each scan time and integrates the projected activity into the selected timeframe. Consequently, the result will differ from the raw sum of each scan time activity.
For example, if you report with “scan time,” you can obtain:

This means that the system performed a scan of well A1 at time = 0.5 minutes and measured 11 activity counts, another scan at 3.4 minutes with 12 counts, another at 6.5 minutes with 11 counts, another at 9.6 minutes with 11 counts, and another at 12.8 minutes with 11 counts.
The duration of each scan is not visible to the user, but it is recorded by the software, which saves the time of each read.
To simplify, assume that each scan takes one minute. If we want to know the activity on each minute, the measured activity is:
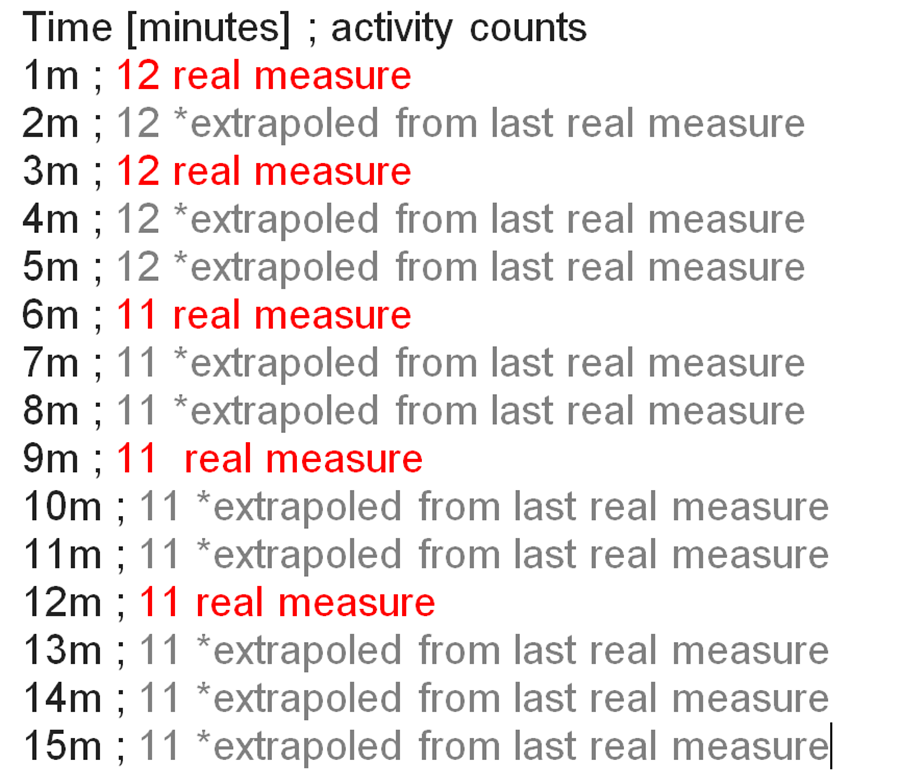
Therefore, the manual integration of activity counts from minute 1 to minute 15 results in: 12*5 + 11*10 = 170 activity counts over 15 minutes.
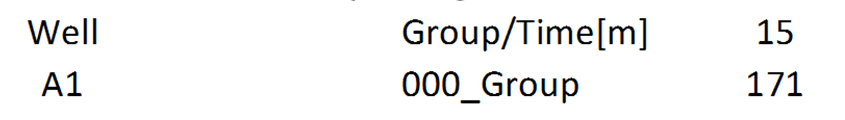
In this experiment, if we generate the report using a 15-minute bin size, we obtain a very similar result compared to the manual integration calculus:
We hope you understand now in deeper details the math behind calculations.
If you have any question don’t hesitate to contact us.