A Z-stack is a merging of images in the Z-dimension, a common tool for confocal images. However, utilizing Time as a Z-dimension generates a rich integrative image file containing the marked trajectory of moving particles in X-Y.
Let’s look at an example to clarify.
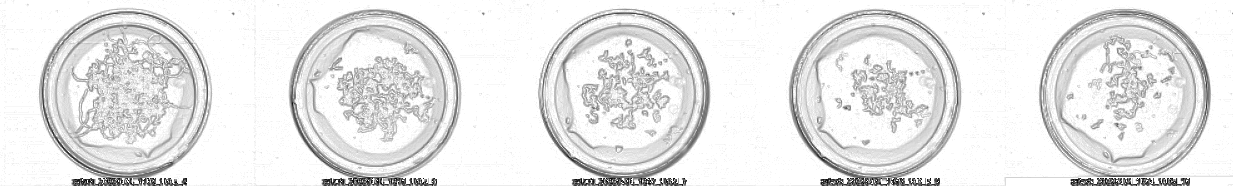
This is a subset of Petri dish images. A sequence of frames:

And this is the Z-stack result using a composition with the minimum of each image:

You can appreciate that using the timing Z-stack, we can reconstruct the movement of worms in NMG, even appreciating the performed body bends. The software can automatically calculate Z-stacks using the minimum value of the images for merging.
A valuable tool to showcase in your publications is to create a Montage of Z-stacks.
Suppose you have kinetics data, and you want to add representative imaging information on how the worm moved in the plates.
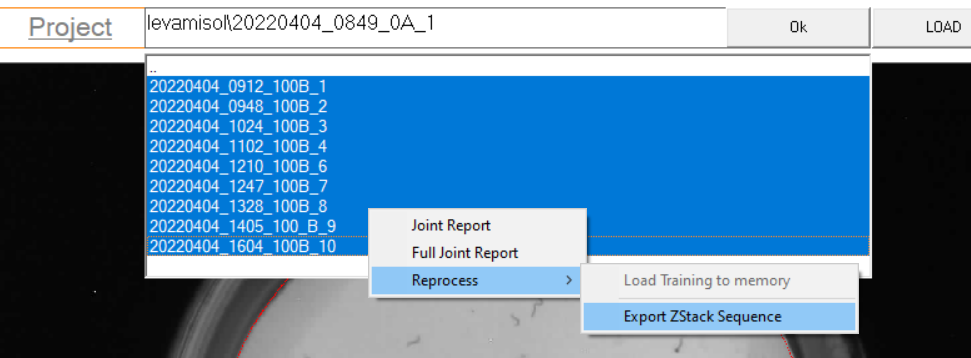
Start by exporting the Z-stack for each acquisition,
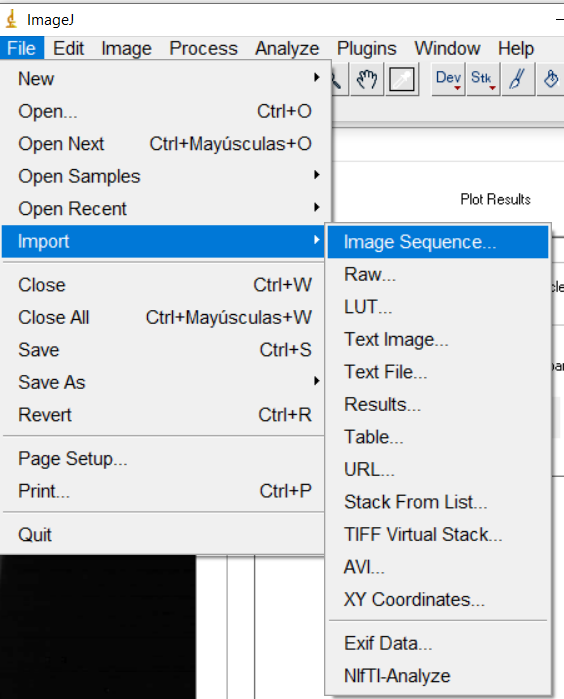
import z-stack files using the “Import image sequence” with ImageJ,

and create a montage specifying the desired number of columns and rows.

The result will be something like this:
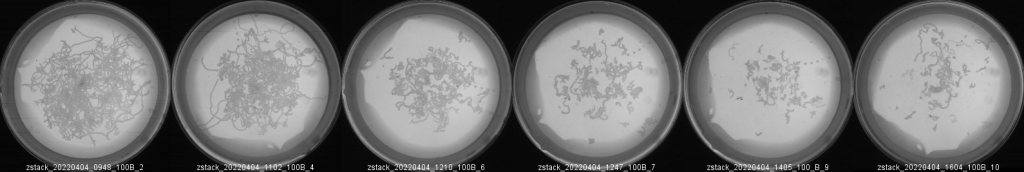
As example, this figure may complement a bar plot showing the travel-distance decayment upon levamisole treatment:
