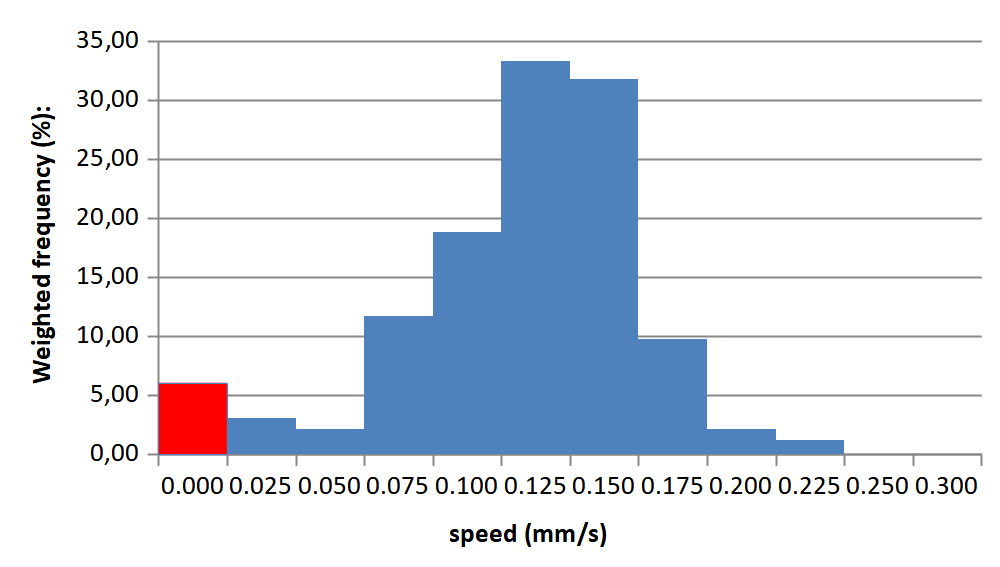
Data analysis is essential for interpreting the results of your experiments. One of the best ways to visualize the distribution of the speed of the particles is through a histogram. This type of graph allows you to observe the frequency of activity values across different ranges, making it easier to identify patterns or variability in the response of the studied organisms.
WMicrotracker SMART provides information on individual particles and the number of frames in which each was detected. Using these data, you can generate a weighted histogram based on the number of frames in which each particle was registered.
Steps to Generate a Weighted Histogram by Frames
- Extract the data
At the end of an experiment with WMicrotracker SMART, export the data in .csv format from the software. At the bottom of the file, you will find information on each identified particle (Particle trails). - Generate the histogram
We provide a spreadsheet template where you can copy your acquisition data to automatically generate a weighted histogram based on the number of frames in which each particle appeared.
You will only have to paste the data of the particles trails on the “enter data” sheet of the file .
This histogram will help you analyze the distribution of activity in your samples, making it easier to detect differences between treatments and identify outliers.