Experiment report files can be quickly and easily accessed either immediately after an experiment run, or at any later time. Report files are generated as a .CSV file by default; we recommend MSExcel, OpenOffice or LibreOffice for easy managing of the report files.
Generation of an Immediate Report
At the end of an experiment run, the following “Generate Report” window will automatically appear:
You have several options for data export arrangements: by “Rows”, “Array” or “Map Plot” format.
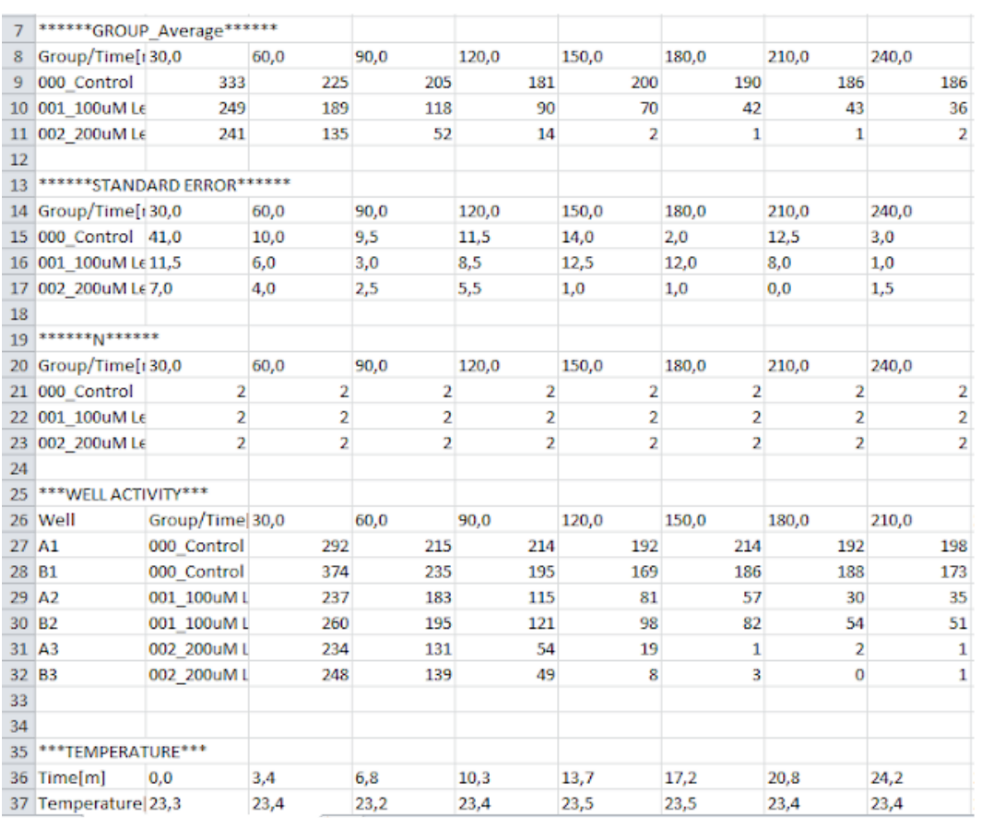
i. Rows will provide data for each well in an individual sheet row.
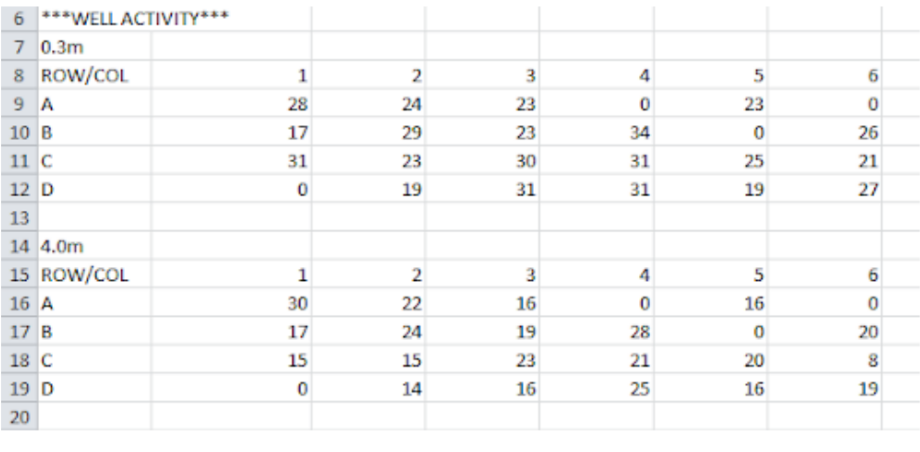
ii. Array will provide data for each well in plate-format layout.
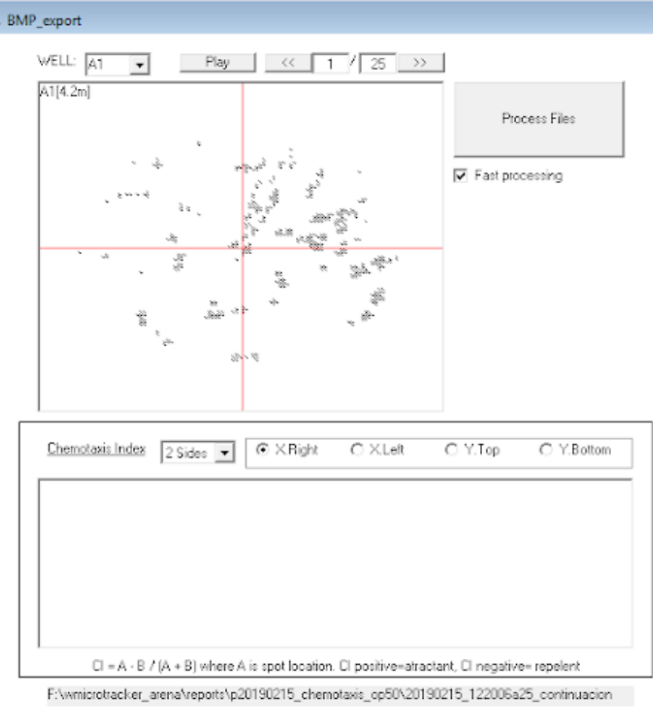
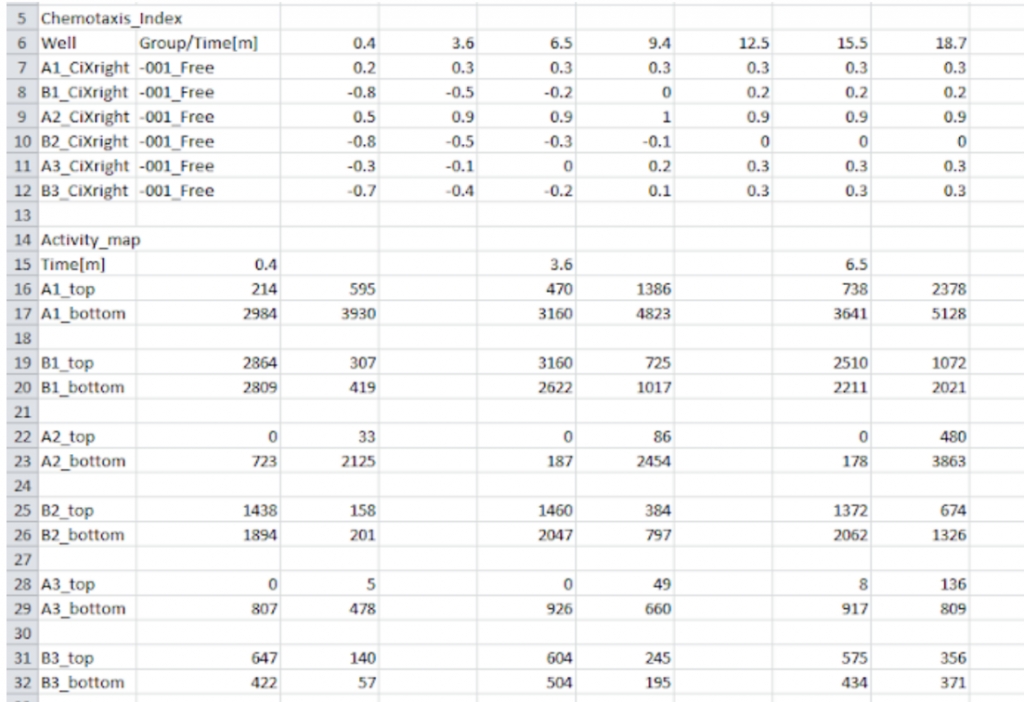
iii. Map Plot will provide data of the activity relative-location for each well, calculating the Chemotaxis Index at each ScanTime. Choose the correct design of the plate for the analysis (2 sides/quadrant) and the test spot location. Then, click on the Process Files button to run the analysis.
Export and view the data using different “Bin Size” formats.
- Scan Time bin size will output data for each individual scan taken of each well in your plate.
- Minute Bin sized activity (ex: 30, 60 min bins) will transform scanned counts into Time blocked activity and will output that information.
Important: When the data is exported in Bin Sizes of different # Minutes the software will integrate "scan time" data using one minute resolution timeframe transformation. So, the result will differ from the raw sum of scantime activity.
- You can also modify the “File” and “Spacer” fields as best suited to your data analysis needs.
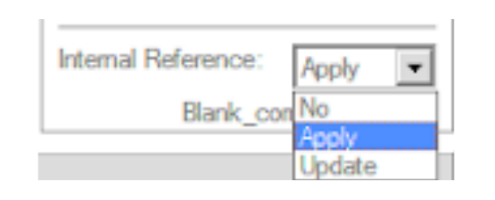
- To Apply internal reference. By default it will apply factory internal reference.
- To Apply Blank Correction. (See Blank measurement in Appendix D).
When you are ready to view your data, press “Generate”. This will automatically open a new window with your data displayed; data can be analyzed or further saved from this new window, as required.
Exporting Previous Experiments
You can access your data at any time after a completed run directly through the software main screen.
– Press the “Load recorded experiments” button at the bottom right; this will open a “Previous Experiments” menu on the main screen:
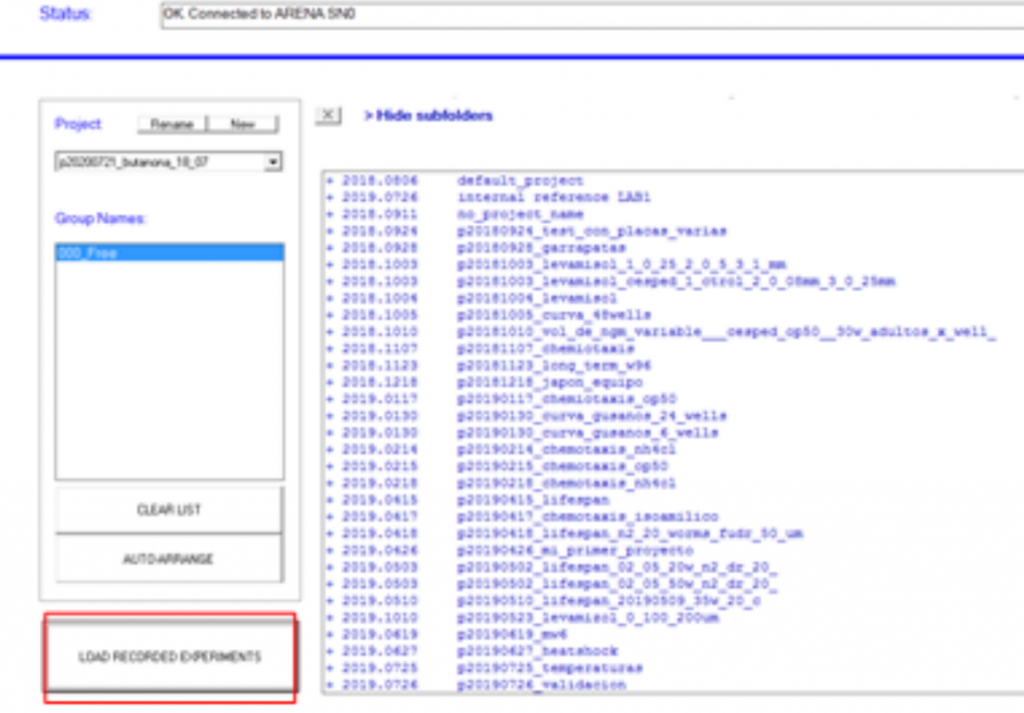
– Select the desired project name from the list; each project will expand to show the acquisitions (if more than one) that were collected for that project. Select and double-click the appropriate acquisition and the “Generate Report” window will appear, allowing you to export data in the format you wish.
NOTE:
You can also access your data at any time directly through the “Reports” folder that was installed with your software. It will contain all the project data acquired on your ARENA instrument.
– In the computer location you chose for the software, simply navigate to the Reports folder to see all stored project data:
– Select and open the project folder you wish to analyse; this will lead you to files containing activity data and temperature data for the experiment.
– Select and double-click the “_report.csv” file that you wish, this will automatically open a new window with your data displayed; data can be analysed or further saved from this new window, as needed.