
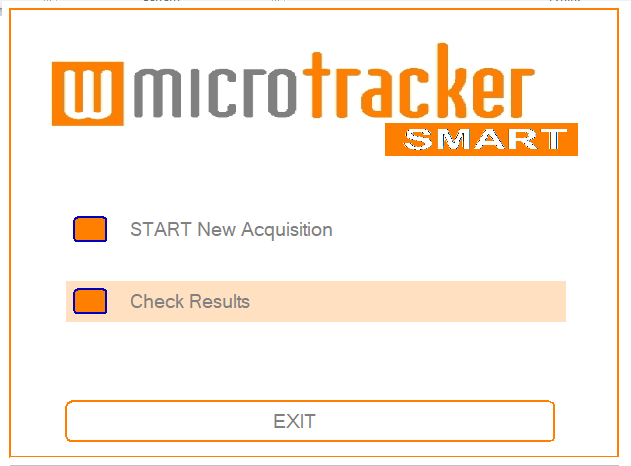
The WMicrotracker SMART system reliably detects and records movement. Experiment report files are easily accessible, either immediately after acquisition or later through the ‘Check Results’ menu.
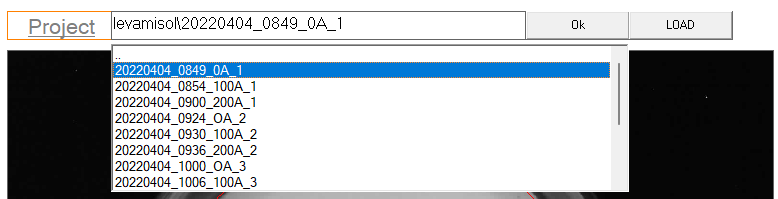
To get started, you’ll need to select and load the acquisition you’re interested in. Experiments are organized in folders by project name, each containing all acquisitions listed by date. Choose and “Load” or double-click to load the desired experiment.
Afterward, click on ‘Plot Results’ to load all the images of the acquisition. In tracking mode, the paths of the detected particles, based on the last saved training for that acquisition, will appear in the plate layout area. In microbeam mode, the location where the activity was detected will be displayed.
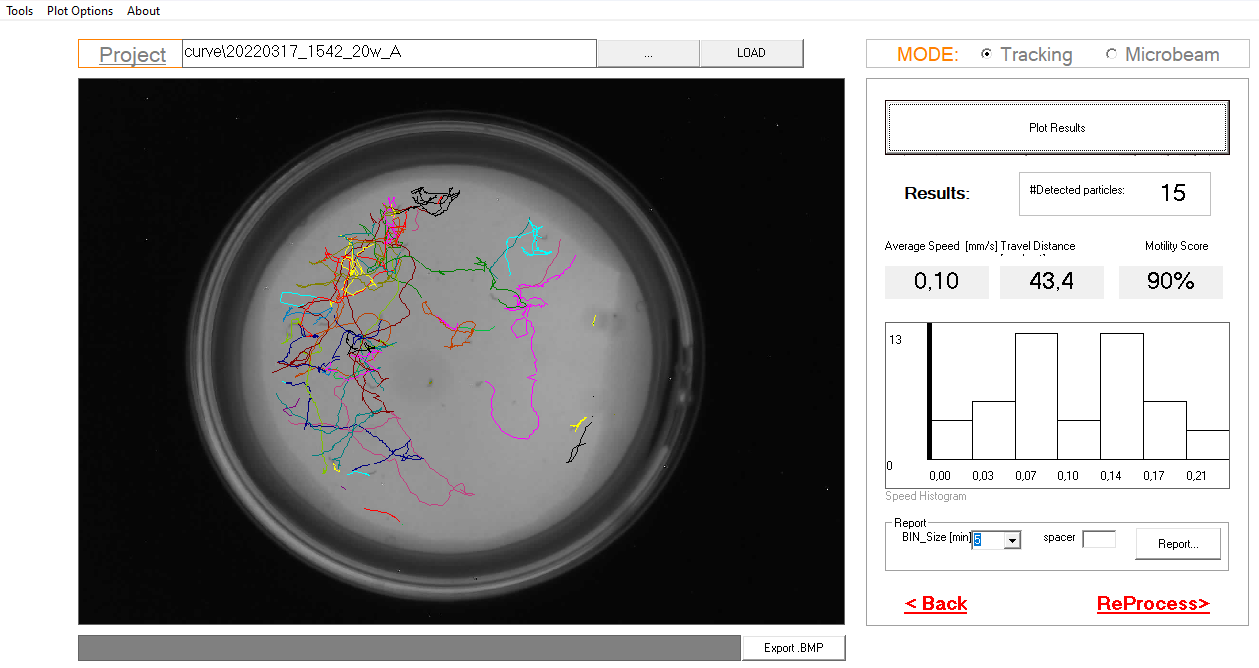
Click on ‘Export BMP’ to save the currently displayed image as a .bmp file.
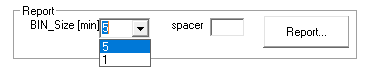
On the right panel, summarized results will be presented. To export data to a datasheet, click on ‘Report’. Users can customize the time intervals by adjusting the ‘Bin Size’ drop-down menu. The exported datasheet will then organize the reported parameters accordingly. Additionally, choose the appropriate spacer (, or 😉 based on the software you are using.
The reported parameters vary depending on the mode in which the experiment acquisition was performed:
- Tracking mode report
- Microbeam mode report.
You can generate a comprehensive report that combines data from various acquisitions within the same project by using the [Joint Report] function.
Furthermore, during a tracking mode acquisition, if it becomes necessary to retrain the software, you have the flexibility to do so. You can ‘Reprocess’ the acquisition with new training. (Check this link)